From http://www.skepticalscience.com
The data (green) are the average of the NASA GISS, NOAA NCDC, and HadCRUT4 monthly global surface temperature anomaly datasets from January 1970 through November 2012, with linear trends for the short time periods Jan 1970 to Oct 1977, Apr 1977 to Dec 1986, Sep 1987 to Nov 1996, Jun 1997 to Dec 2002, and Nov 2002 to Nov 2012 (blue), and also showing the far more reliable linear trend for the full time period (red).

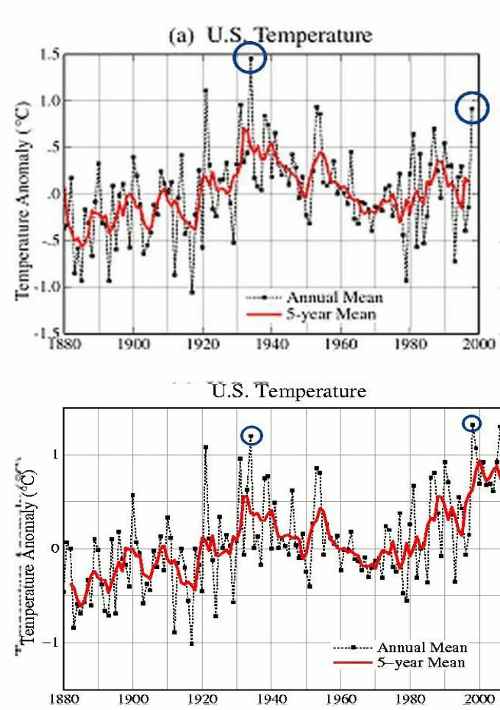
From https://stevengoddard.wordpress.com/

Right after the year 2000, NASA and NOAA dramatically altered US climate history, making the past much colder and the present much warmer. The animation below shows how NASA cooled 1934 and warmed 1998, to make 1998 the hottest year in US history instead of 1934. This alteration turned a long term cooling trend since 1930 into a warming trend.

So, which graph is the truth? How do we tell? Do the "adjustments" mentioned in Rick's article play a part in the overall thinking on the subject? Does modern climate "modeling" and "alterations" play a positive or negative role? Does the 2+ degree increase measured at Mohunk Preserve hold true for a national or global conversation? Or does the less than 1/2+ degree change shown in the graph above guide us going forward?
Comments are welcome. After all climate change is a 29 Billion dollar a year tax payer supported industry. Are we getting the truth? Are we getting our money's worth?
William
ReplyDeleteWithout understanding the reasoning behind adjustments and modeling,which none of us mere mortals will ever understand,Then why in the hell are qualified dissenters subjected to harassment,ridicule and even in some cases threats.
What are these Climate Change advocates afraid of ?
I thought real science was all about peer review,not the silencing of peer dissension.
The truth may be in your last paragraph..
Here is a site from which anyone can download the raw data and do their own calculations. I don't envision many people doing this, but here it is.
Deletehttp://www.cru.uea.ac.uk/cru/data/temperature/#faq8
Here is the raw data: http://www.cru.uea.ac.uk/cru/data/temperature/#faq8
DeleteThe first two graphs show a series of short term averages, sometimes called running averages., and the long term average for the whole period. The data sets themselves are the same. The last graphs show two obviously different data sets. The one which shows cooling seems to be for the U.S. only, while the one which shows continued warming may be global, although they are both labeled U.S. Temperature anomaly is the difference between the observed temperature and the long term average for that date. Rojayalso, I don't believe that weather scientists are trying to perceive the public. I say this because I was been engaged in scientific research for 40 years, although not in climate but in solid state physics. Anyway the peer review process is rigorous and brutal, since researchers are basically competing with each other for reputation and grants, every submitted paper is challenged by experts in the same field, I have never heard of peers being silenced, at least not in my field. I hope my comments are useful William, I am not taking Political sides in this, just trying to get to the truth. Finally here is a reference which shows anomalies for the Earth.
ReplyDeletehttp://neo.sci.gsfc.nasa.gov/view.php?datasetId=MOD_LSTAD_M
Sorry, that should be "deceive" the public. I actually hope they "perceive" the public.
DeleteThis comment has been removed by a blog administrator.
DeleteMick
DeleteSorry I posted a comment before reading your complete post to William.
Maybe I can dig up a few links to stories that I had bookmarked.Haven't posted in a while and have cleaned up my list of ammunition.
http://mohonkpreserve.org/weather-data
Deletebecause of the extent of these records I can only post the link it is fascinating what these people have done whether you agree with them or not. Seriously give it a look.
I ask again. Is the crew from Skeptical Science or Mr. Goddard telling the truth? Did NASA and NOAA dramatically alter US climate history records using modeling and other devices post 2000 as Mr. Goddard posits? Or did they not?
DeleteThere is only one side telling the truth? Which is it? Without light being shed on the basic truth how can we ever hope to form efficient policies going forward?
Or does the US government and UN climate agency not want to create efficient policies?
Which is it? This is not a subjective query.
I don't know the answer, wish I did.
DeleteHow can we base trillions of dollars of decisions on data that we do not know for a fact is true? Is there a NASA or NOAA rep out there who will step forward and produce definitive data and answers?
DeleteOr is this entire global warming/climate change debate based on slight of hand?
What is it?
I don't know the answer either William. I have presented to you the results of a weather station that is totally untied from the controversy. The results there post 2000 show that yes the climate is warming and the warming is accelerating. Needless to say we probably need more independent results like these if we can find them. Then regardless of what NASA or NOAA does we have a true analysis of trending patterns.
DeleteBut the bigger question William is this, I don't think the question is if the earth is warming. It appears that it is. In the climate change debate the question is , Are we, mankind causing it or accelerating it, or is this the way it works over the long haul, the long haul being not decades but eras, epochs, etc. That I don't think, we can ever determine with true accuracy